
Production Analytics · Downtime Intelligence
See every barrel
you lost - And why.
Obsidian is downtime intelligence software for upstream oil & gas operators - every deferred barrel categorized by root cause, in real time.
The Problem
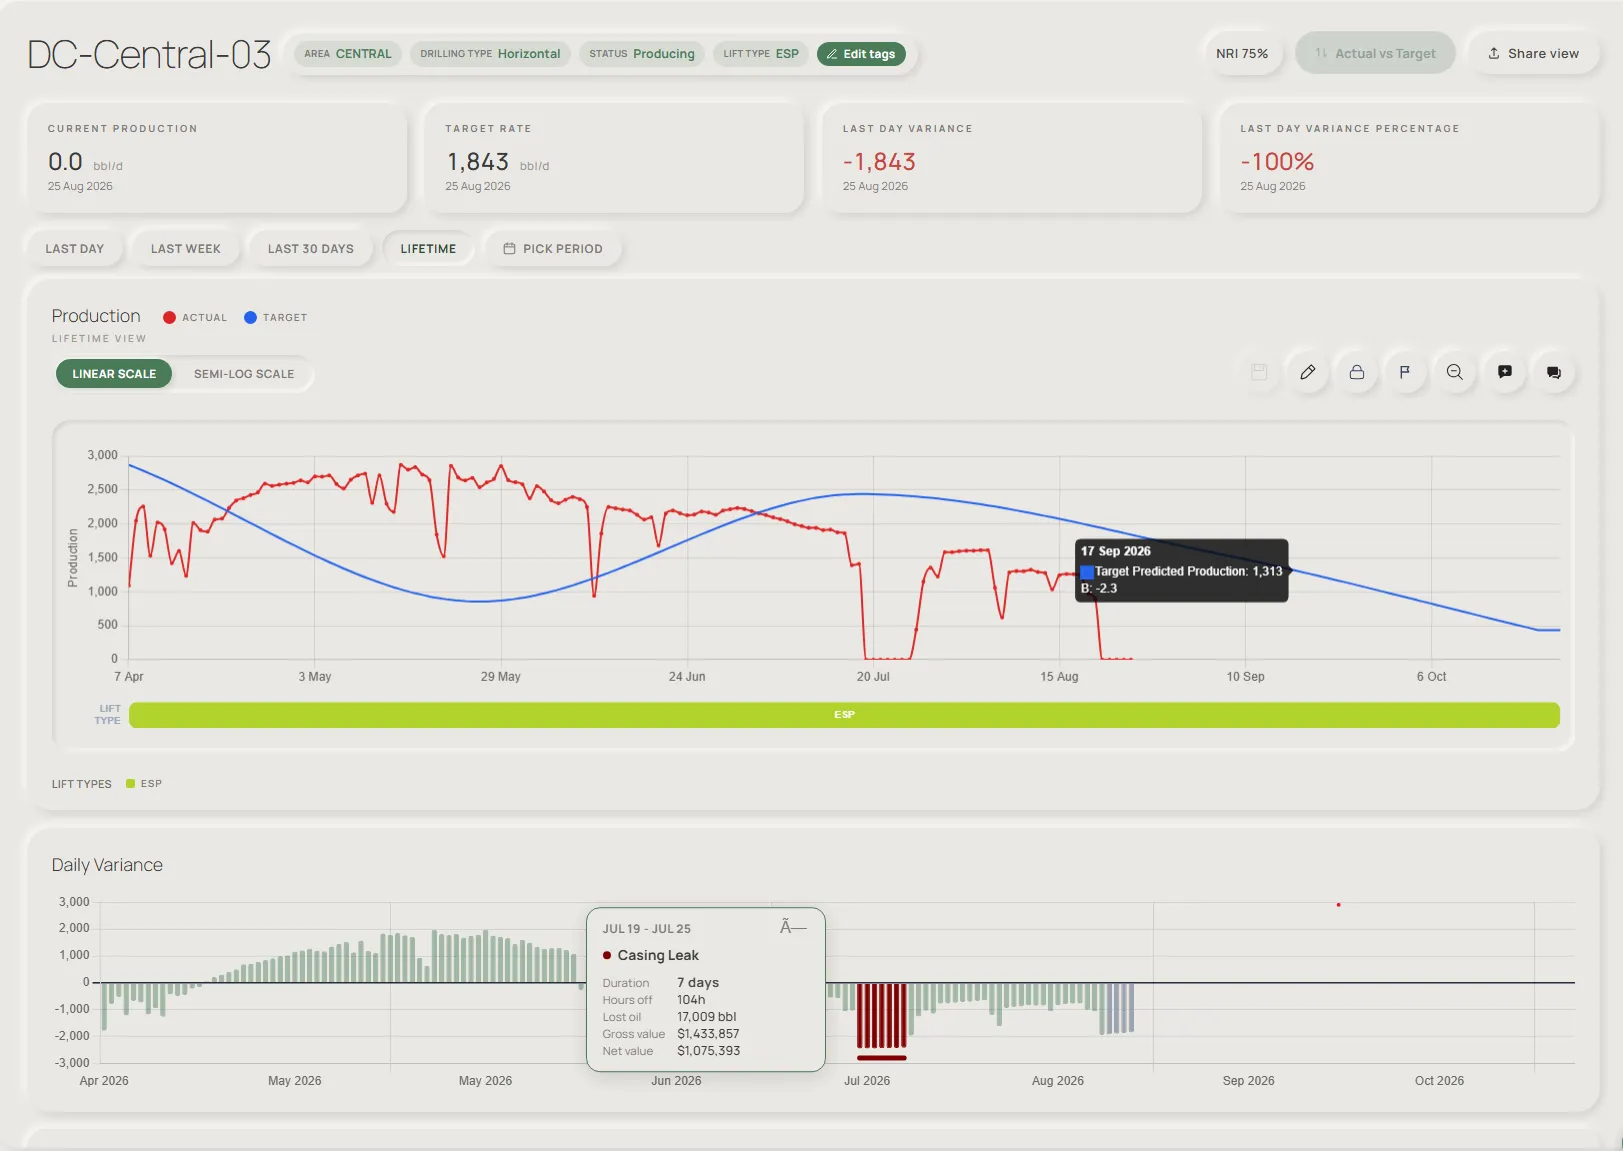
Deferred production hides in plain sight
Deferred production is oil an operator was on track to produce but lost to unplanned downtime, and it rarely shows up as a single line item. Instead it is spread across dozens of wells and shift logs, so the barrels - and the dollars they represent - go untracked until someone reconciles the numbers by hand.
8-12%
of annual output lost to unplanned downtime industry-wide
40+ hrs
average time to trace a loss event back to root cause
3-5
disconnected spreadsheets used to track production losses
Why it stays hidden
- Downtime is logged inconsistently across field, ops, and engineering teams.
- There is no shared taxonomy for cause of loss - mechanical, weather, workover, market.
- Root-cause analysis happens after the fact, if at all.
- Leadership sees downtime, but production barrels in recovery are not quantified.
Introducing Obsidian
One platform that categorizes every lost barrel
Categorizes automatically
Applies a configurable taxonomy to classify each event by cause - mechanical, weather, workover, regulatory, or market.
Ingests every signal
Pulls SCADA and field data into a single variance record - no re-keying.
Quantifies the impact
Converts downtime hours into unrealized barrels and dollars, by well, pad, and field.
Routes to the right team
Surfaces mechanical issues to maintenance, weather events to ops, automatically.
Production Daily Target
What sets our target apart
- Set by each production engineer
- Declines day over day rather than a 30-day average target
- All barrels are accounted for, positive or negative
- Leadership sees a complete picture of production
See It In Action
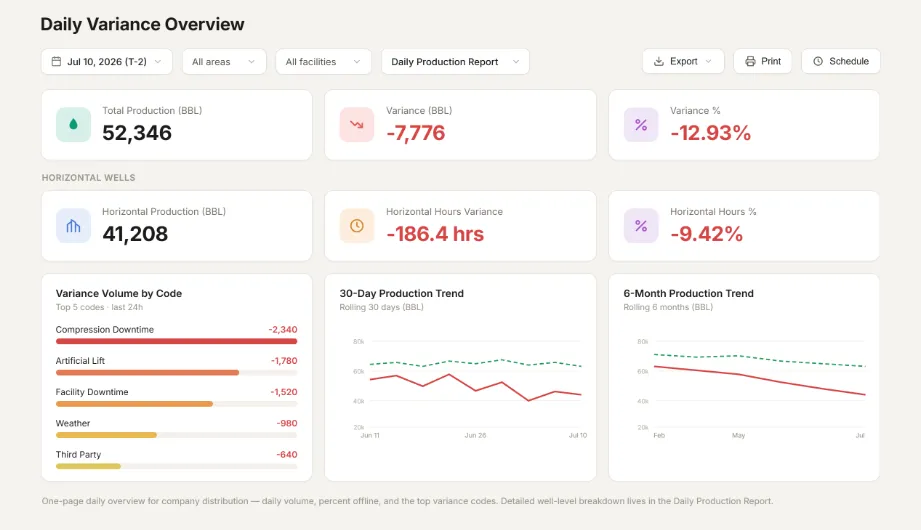
Lost production, broken down by cause
Work From The Field
Stay productive from the field
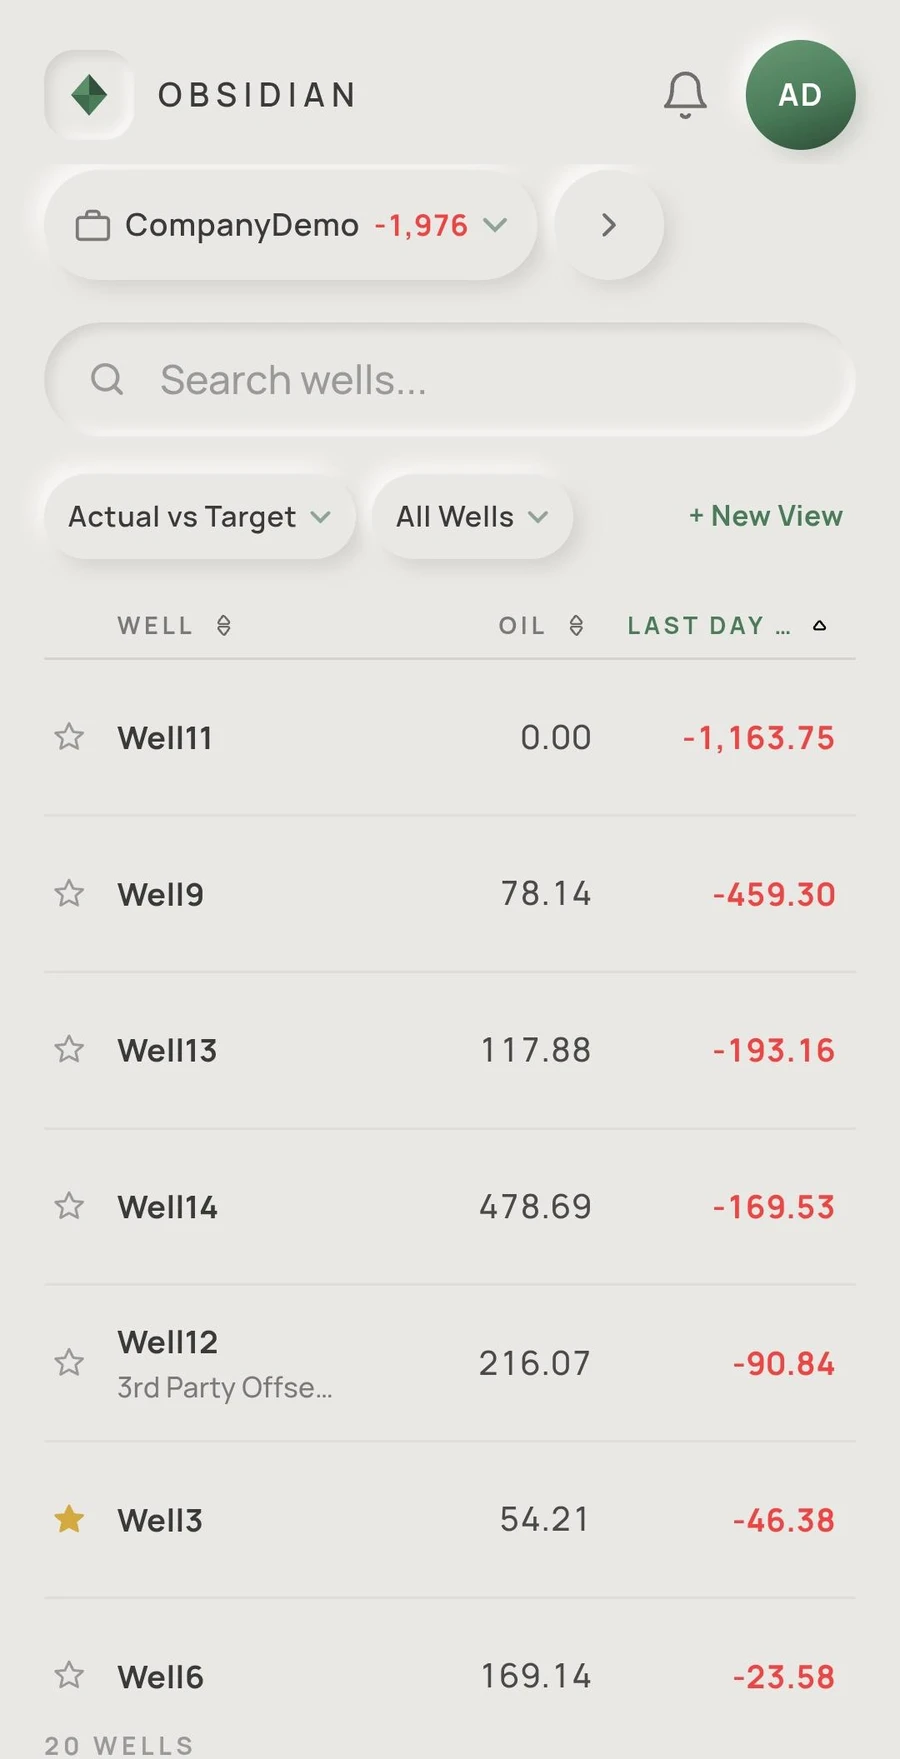
No need to return to the office. With the Obsidian mobile app, field workers and teams can access the information they need and get things done wherever they are.
 App Store
 Google Play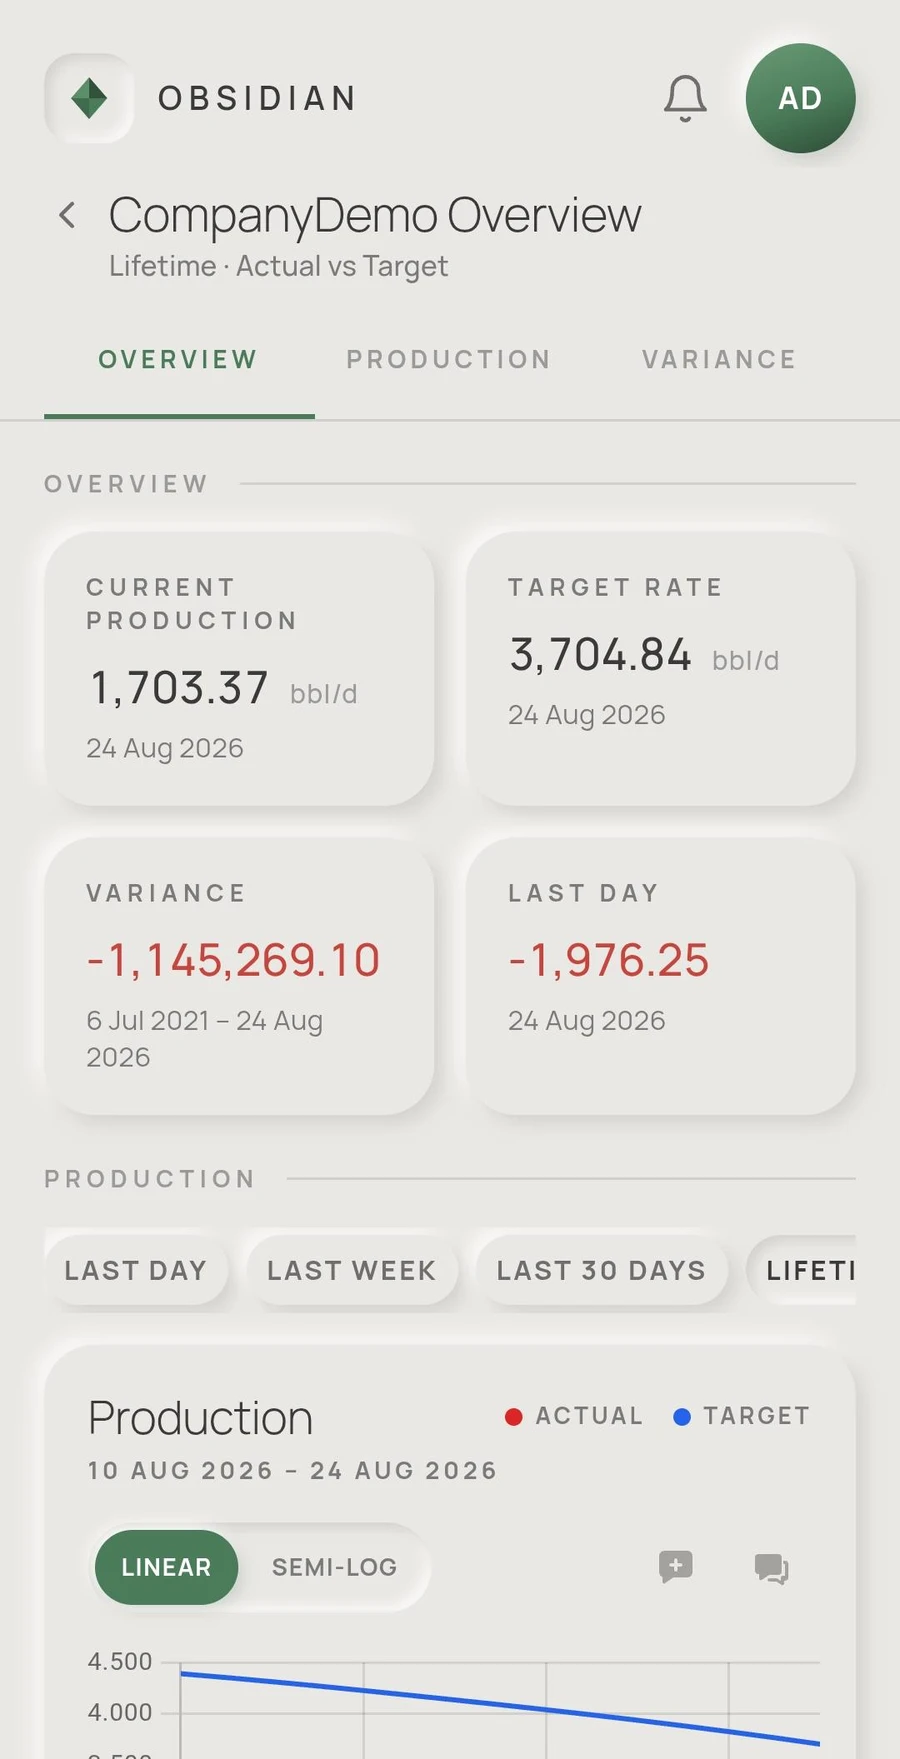
How It Works
From raw signal to categorized loss in four steps
- 01
Data Ingestion
SCADA, historian, LOWIS/production accounting, and manual entries stream in continuously.
- 02
Event Detection
Variance events are detected automatically against expected production baselines.
- 03
Categorization Engine
Each event is classified by cause using rules plus a learning model tuned to your field.
- 04
Actionable Insight
Lost barrels, dollars, and trends are pushed to dashboards and alerts.
The Taxonomy
A shared language for every cause of loss
Configurable to your operation's existing codes and standards.
Mechanical Failure
Equipment breakdown, pump or compressor failure, and electrical faults account for downtime classified as mechanical.
Weather & Environmental
Freeze-offs, storms, flooding, and other environmental conditions drive shut-ins classified as weather.
Workover & Maintenance
Planned interventions, recompletions, and preventive maintenance produce downtime classified as workover.
Regulatory & Compliance
Permit holds, inspections, and mandated shut-ins are grouped under regulatory and compliance downtime.
Market & Economic
Price-driven curtailment and take capacity constraints are categorized as market and economic downtime.
Unclassified
Events are flagged as unclassified for review when a cause can't yet be determined.
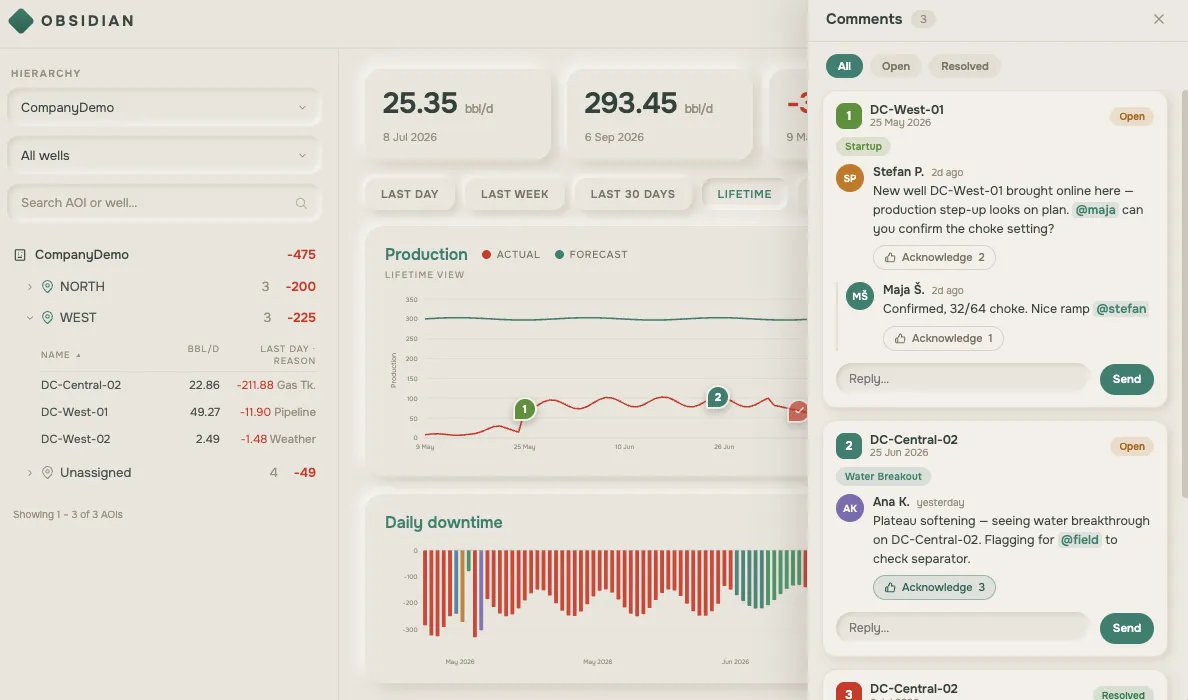
Team Communication
Communication throughout your organization
- Communication
- User-friendly troubleshooting between field and office.
- Historical Record
- Keeps records of all communication down to well level.
Why Obsidian
Replace the spreadsheet with a system of record
A system of record means every lost barrel is categorized once, in one place, and stays consistent no matter who looks it up later. That replaces the manual process most operators run today, where each field or shift keeps its own spreadsheet and the numbers drift apart.
Manual process: Categorization happens weeks after the event
With Obsidian: Categorized immediately
Manual process: Every field uses a different taxonomy
With Obsidian: Recovery barrels quantified
Manual process: Root cause buried across emails and logs
With Obsidian: Root cause attached to every event automatically
Manual process: Reports built by hand for each review
With Obsidian: Live dashboards, always current
Key Benefits
What field teams see in the first two quarters
FAQ
Common questions about Obsidian
- What is Obsidian?
- Obsidian is downtime intelligence software for oil and gas upstream operators - it is not related to the Obsidian.md note-taking app. It categorizes every deferred barrel of oil production by root cause, in real time, so operators know what was lost and why.
- How does Obsidian categorize deferred production?
- Obsidian sorts every downtime event into one of six root-cause categories - mechanical failure, weather and environmental, workover and maintenance, regulatory and compliance, market and economic, or unclassified - configurable to an operation's existing codes and standards.
- What data sources does Obsidian ingest?
- Obsidian ingests SCADA, historian, LOWIS/production accounting, and manual field entries continuously, then detects variance events automatically against expected production baselines.
- Who is Obsidian for?
- Obsidian is built for upstream oil and gas operators - field, operations, and engineering teams who need a shared, real-time view of deferred production instead of disconnected spreadsheets.
- Is there a mobile app?
- Yes. The Obsidian mobile app lets field workers and teams access production and downtime data and get things done without returning to the office.
- How is this different from tracking downtime in spreadsheets?
- Spreadsheets categorize downtime by hand, days or weeks after the event, and drift out of sync across fields. Obsidian categorizes every event automatically and immediately, giving every team the same live dashboard as the system of record.